Installing Goaccess, a Visual Website Log Analysis Tool
Software Introduction
Goaccess is an open-source real-time website log analysis tool. Goaccess works by reading and parsing the access log files of servers such as Apache/Nginx/Lighttpd, displaying statistical information in an intuitive way, including an overview of visits, dynamic page requests, static page requests, visitor rankings, visitors' operating systems, visitors' browsers, referring domains, 404 errors, search crawlers, search keywords, and more.
Goaccess not only uses different colors to distinguish information in the terminal, but can also output detailed charts for users' reference. It supports the analysis of server logs from Apache, Nginx, Amazon S3, Elastic Load Balancing, CloudFront, and others. It is not limited to LNMP; any of the log formats listed above can be used.
Installing Goaccess
Install the dependency packages, and be sure to distinguish between your systems.
Ubuntu/Debian:
apt-get install libncursesw5-dev libgeoip-dev libtokyocabinet-devFedora/RHEL/CentOS:
yum install ncurses-devel geoip-devel tokyocabinet-develInstall Goaccess by executing the commands one by one in order.
wget http://tar.goaccess.io/goaccess-1.2.tar.gztar xzvf goaccess-1.2.tar.gzcd goaccess-1.2/./configure --enable-geoip --enable-utf8make && make installHow to Use
Generate a chart webpage.
goaccess -f /home/www.ikxin.com.log --log-format=COMBINED -a > /www/wp-xinye/web.html/home/www.ikxin.com.log is the path to your log file.
/www/wp-xinye/web.html is the path to the page you want to generate.
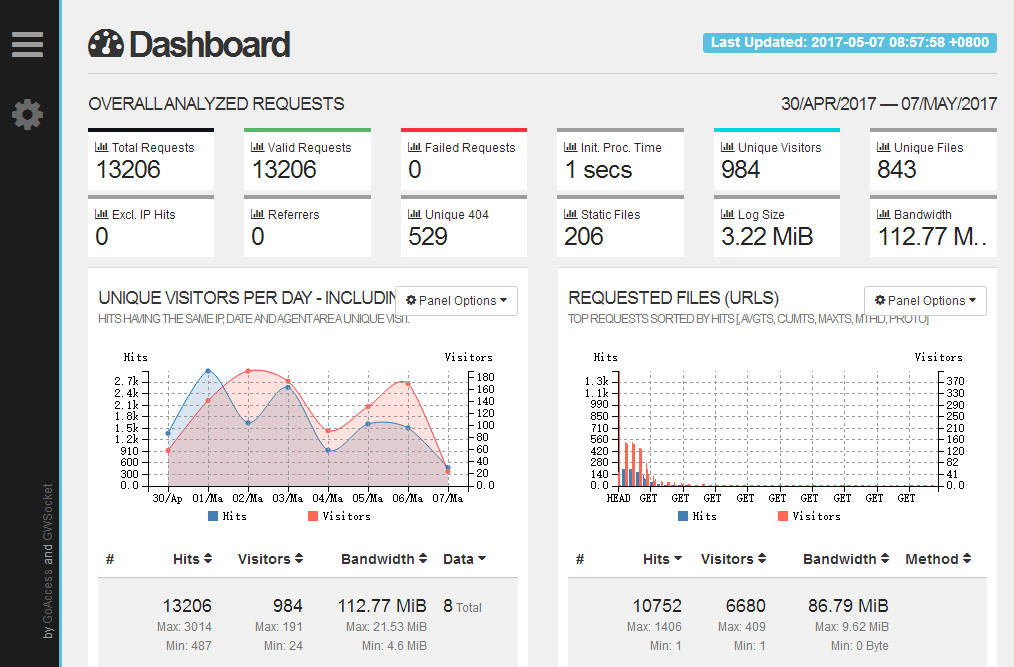
This generates a highly intuitive webpage chart that can be opened directly in a browser for viewing.
You can also use it with crontab to run it periodically and automatically generate charts.
Execute: crontab -e
Add a line:
50 23 * * * goaccess -f /home/www.ikxin.com.log --log-format=COMBINED -a > /www/wp-xinye/web.htmlThis means that a log webpage chart for the corresponding domain will be generated every day at 23:50. Below is one of my own charts.
Comments
(0)No comments yet. Start the conversation.